In their provincial referendum of October 18, Albertans voted 62 percent in favour of removing the equalization program from Canada’s Constitution. The following month the Legislature held its debate to ratify the result and send Ottawa a request to enter into negotiations. The likelihood of the required constitutional amendment or even the negotiations happening is vanishingly small. The referendum result is, however, the most pointed and credible expression to date of Albertans’ belief that the equalization program – which totals $21 billion this fiscal year and is growing every year – is inequitable, unbalanced and must be changed.
Scrutinizing the flow of funds suggests a basis for this view. Quebec received $13.3 billion in equalization payments in fiscal 2021, despite having top-notch government services, running a budgetary surplus and building up a savings fund nearly as large as Alberta’s Heritage Fund. Albertan taxpayers, meanwhile, contributed $3.7 billion in equalization last year, despite being in the sixth year of a punishing economic downturn.

A deeper theoretical backing for Alberta’s critique of equalization is often sought in the details of the program’s funding formula. It is legislative and regulatory in nature, so it could be changed without amending the Constitution. But it has grown so complicated that only a few specialists understand it fully. Without an accepted set of well-understood facts to work from, discussions focused on equalization’s “unfairness” usually devolve into a “he-said, she-said” dispute among academics or equalization hobbyists over ambiguous clauses. Program defenders are able to portray Alberta’s central contention as simply in the eye of the beholder. And there the discussion bogs down.
Since the current funding formula is all-but incomprehensible, adding still more modifications is unlikely to resolve the impasse. Perhaps, instead, the formula itself should be redesigned entirely, from first principles – namely, the basic equalization requirements specified in the Constitution. These are surprisingly succinct and the key ideas are understandable to anyone. If we could devise a funding formula that is constitutionally compliant as well as inarguably equitable and balanced – and do so using a brief and clear set of provisions – then perhaps we could convince Albertans to accept the new approach and, in turn, avoid attempting to reopen the Constitution. And then the wounds to our federation caused by this contentious issue could begin to heal.
Redesigning the Formula
Equalization began as a government program in 1957 and was only incorporated into the Constitution in 1982. Section 36 (2) states: “Parliament and the government of Canada are committed to the principle of making equalization payments to ensure that provincial governments have sufficient revenues to provide reasonably comparable levels of public services at reasonably comparable levels of taxation.”
So let us take the Constitution at its word. To begin, we need to define its key terms:
- “Sufficient revenues”;
- “Levels of public services”;
- “Levels of taxation”; and
- “Reasonably comparable.”
These are challenging questions. If there is to be a better way, we must begin by defining these key terms and basing our definitions on practical metrics that facilitate measurement and comparison in the real-world context of Canada.
Measuring Level of Public Services
Public services vary substantially from province to province and from time to time. Quebec has $10-per-day daycare, for example, which no other province yet has. Provinces don’t all offer the same insured medical services – of which there are thousands of individual items. Is an MRI better than a biopsy for the same condition, and what is the resulting “level” represented by each approach? Are waiting times a good enough proxy for “levels” of medical services? And what if waiting times are measured differently from province to province? Such variability extends across every government department, organization and agency. And even the “same” procedure or service might vary in quality or effectiveness, meaning the “level” isn’t the same after all.

Identifying, classifying and comparing each of these thousands of differences, plus tracking and comparing all the changes from year to year, would be virtually unachievable. Knowing this, can the “level of public services” even be sensibly measured for comparative purposes? Yes, it can, at least indirectly. Public services are provided primarily to individuals – think of health care, education, police protection, court proceedings, social services and so on. Even things like roads, in the end, can be seen as benefiting the individual people driving on them.
So a reasonable way to “measure” public services would be to utilize a plausible proxy that takes this relationship into account. The proposed proxy is the amount of money each provincial government has available to spend on these services from areas within its control, without outside help, on each person in the province: its own-source revenue per capita. This value can be determined using data from the provincial public accounts, which are readily accessible.
Figure 1 shows the various sources of provincial government revenue grouped in logically related categories. Items inside the green box labelled “Own-Source Revenue (OSR)” are entirely within provincial jurisdiction. The percentages are the approximate average proportion that each item contributes to the average province’s OSR, determined using data from 2017 provincial public accounts. OSR represents, on average, about 72 percent of a province’s revenues. The rest is comprised of federal government transfers and deficit financing as shown in boxes in the purple area.
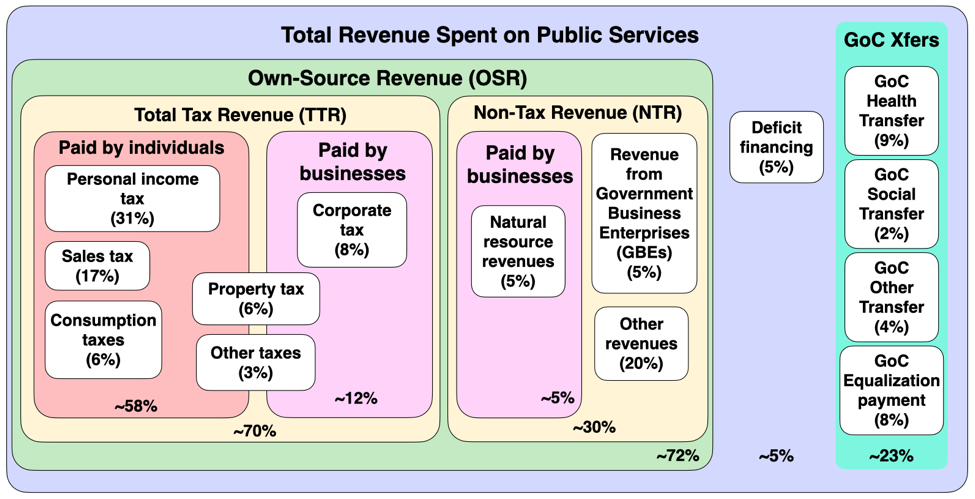
Readers should not get hung up on strict private-sector accounting definitions of “revenue”; in our context the term is used to mean all monies which a provincial government generates as a result of its own actions. (Because annual budget deficits are also used to fund public services, which lower a province’s tax rates at least for the short term, it could be argued that deficits should be included in OSR; this topic is explored later.)
Defining “level of public service” in this way is a big step. It bypasses and thereby renders irrelevant the otherwise-impossible task of individually measuring and comparing each government service in every province. Equally important, it answers some of our other questions, for it then stands to reason that provinces with “reasonably comparable” values for this metric have “sufficient revenues” to provide “reasonably comparable levels of public services,” whatever their specifics might be. (That some provinces might not actually do so due to inefficient delivery, overly burdensome regulations or other reasons is irrelevant; the point is, they have the capacity to do so.)
Measuring Level of Taxation
Simply checking and comparing each province’s statutory tax rates or gross-dollar tax receipts will not fulfill this task, since not only population but types of taxes, per-capita income and the proportion of residents that pays taxes all vary from province to province. A realistic “level” of taxation is the overall tax burden experienced by a “typical” individual taxpayer. Expressed as a percentage of average individual income, it provides a clear metric based on publicly accessible data offering inter-provincial comparability. Determining this is relatively straightforward.
Looking again at Figure 1, the most obvious tax categories are personal income tax, provincial sales tax, consumption taxes (alcohol, cigarettes, etc.), property tax and what the financial statements label “other” taxes. Some of at least property taxes and “other” taxes, however, are paid by businesses and existing financial statements do not separate the amounts paid by individuals from those paid by businesses.

Here we must be careful; since a higher than “reasonably comparable” level of taxation might lead to eligibility for an equalization payment (see later discussion), it could become possible for a provincial government to qualify by having an unusually low business tax with higher personal taxes. This would be perverse; equalization eligibility should not be triggered by arbitrary policy differences that don’t reflect a province’s overall fiscal position, nor should it be possible to game the formula with carefully selected policies. To avoid this, it seems reasonable simply to include all tax revenue, including business taxes, in measuring the level of taxation even though some portions do not fall directly on the individual taxpayer.
Thus, a sensible metric for level of taxation is total tax revenue expressed as a percentage of the total income of all tax filers in the province. The required numbers are available from, respectively, provincial public accounts and Statistics Canada. For clarity, it is noted that the resulting amounts and percentages are not the statutory tax rates published by each province; nor are they per capita numbers. They are a calculation of the overall effective tax burden that would be borne by the taxpayers of each province if all tax revenue was raised through personal taxes.
If the numerator (total tax revenue) is divided by the number of tax filers, we get the average amount of tax revenue that would need to be collected from every tax filer in order to generate the associated total tax revenue. If the denominator (total income of all tax filers) is also divided by the number of tax filers, we get the average income of all the tax filers.
The ratio of these two numbers, expressed as a percentage, is the fraction of the average income of tax filers that would need to be collected in order to generate the total tax revenue if this was raised solely from individuals. It is a measure of a province’s overall effective tax burden on its taxpayers. It thus provides a sensible and practical metric to express the “level of taxation” for inter-provincial comparison aimed at determining equalization eligibility.
Assessing Reasonably Comparable
What constitutes “reasonably comparable” is probably the most important question – and the one that the current equalization policy particularly mishandles.
The current basic formula is set forth in Section 32(1) of the Federal-Provincial Fiscal Arrangements Act. In effect, it takes “reasonably comparable” to mean any value of what it terms provincial “fiscal capacity” that is equal to or greater than the “national average.” Any level of “fiscal capacity” that is below the average becomes eligible for being topped up to the average by equalization payment. This means that fiscal capacity just $1 below the average would not be considered “reasonably comparable” to a level $1 above the average, even though the difference might represent only 0.02 percent of the overall value. This is nonsensical.
Basing any government program, much less a costly and permanent one like equalization, on the use of averages is illogical as it ignores the effects of inherent variability (discussed below). Inherent variability can make an average misleading rather than illuminating. As it happens, one or two Canadian provinces are perennial outliers with revenues and/or spending that lift the average. There are no longer any abjectly poor provinces to balance things on the low side. The result is eight provinces that spend more or less the same per capita on public services, of which six or seven are, mathematically, “below average.”
This should be harmless if the equalization formula used a rational approach to determine what is “reasonably comparable.” But it doesn’t; it awards payments based on a province’s relationship to the “average” rather than to the other provinces. It means that six or seven provinces receive equalization despite being quite close to most other provinces. And they receive these payments year after year, virtually regardless of how they grow or develop in relation to one another. Because simple math dictates that there will always be “below average” provinces, essentially this means Canada faces “equalization forever.”
Figures 2 and 3 illustrate this in a real-life scenario, using data from 2017 and applying our proposed metric of own-source revenue per capita.
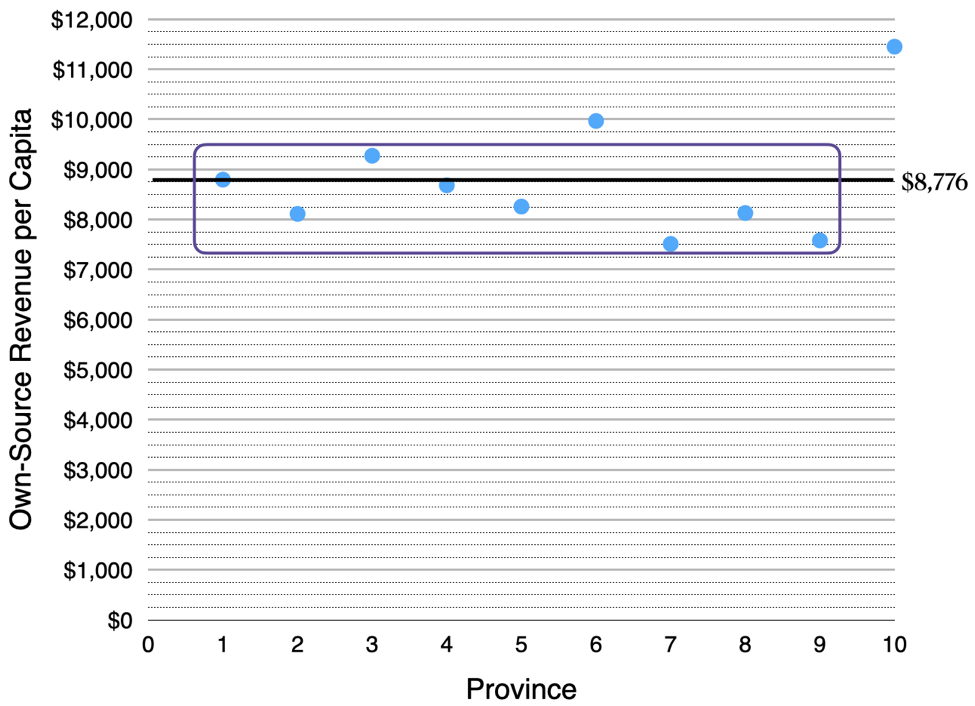
In Figure 2, note how the two outlying provinces with higher OSR raise the average of all ten provinces above the midpoint of the eight closely grouped provinces, creating a large number of “below average” provinces.

The current equalization formula’s effects, again using our proposed metric of OSR per capita, are illustrated in Figure 3. Six “below average” provinces all receive payments that bring them up to the average, and four “above average” provinces do not. Of particular interest are provinces 1 and 4. Province 1 has OSR per capita of $8,795, just slightly above the average of $8,776, and so is not eligible for an equalization payment. Province 4 has OSR per capita of $8,683, slightly below the average, and so is eligible. Yet the difference is only $112 or about 1.3 percent.
That one province should receive equalization and another one not based on such a small difference doesn’t seem reasonable. Surely a rational approach to determining eligibility would assess these two provinces as having reasonably comparable amounts of OSR per capita, therefore enabling them to provide reasonably comparable levels of public services. Fortunately, widely accepted scientific practices offer such an approach.
What do these regard as reasonably comparable? Is, for example, 36 reasonably comparable to 37? Well…it depends…on how much variation is intrinsic to the particular subject of measurement. It is known, for example, that the temperature of healthy humans can vary between 35.73° C and 37.41° C when measured orally. Temperatures within this range are considered normal, and not sufficiently different to indicate a situation requiring remedial action. Thus, 36 and 37 are reasonably comparable in this situation, simply reflecting inherent variability. A temperature below the lower bound would indicate an abnormal situation, possibly requiring corrective action. This practise reflects that observed results in science can vary in detail without signalling that the thing being studied is truly “different” from case to case.
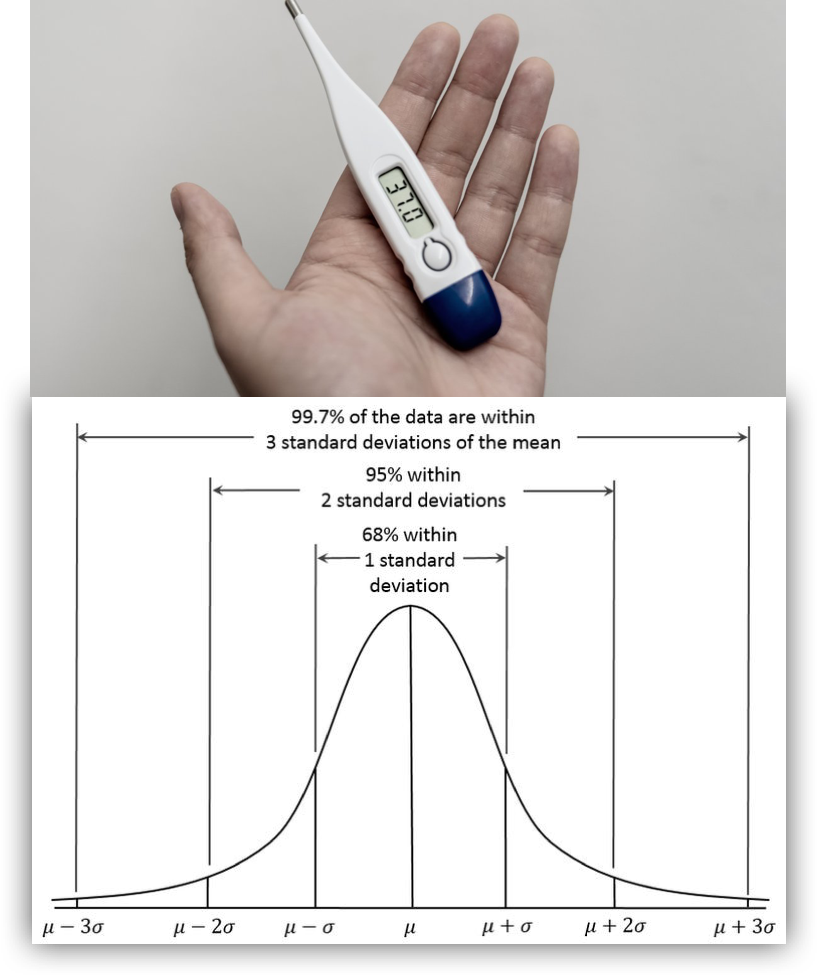
The inherent variability in human body temperature has been established from a large number of measurements. Often, however, the inherent variability of an object of measurement is not known ahead of time. All that we have is a relatively small number of measurements resulting from different experiments or observations. Nevertheless, this still allows natural variability to be estimated by using these measurements or observations to calculate its standard deviation.
Standard deviation is the variation of that set of measurements about the mean, or average, of the measurements. It is used to define a region of “experimental” uncertainty around the average. All numerical results inside this region are regarded as normal; that is, they are not sufficiently different from the average to be asserted to be different. Similar to our earlier example of body temperature, then, all numbers within this range are considered reasonably comparable.
The range of experimental uncertainty is generally taken to be ±1 standard deviation, which encompasses 68 percent of all the measured items. Some branches of science require greater confidence and accordingly use 2 or more standard deviations (the above range for “normal” body temperature uses ±2). But ±1 remains the most common. Experimental uncertainly is routinely applied outside the natural sciences as well. A common example is polling, where the result is typically expressed as accurate within a stated “margin of error, 19 times out of 20.”
It therefore seems eminently sensible to propose that Canada’s equalization program move beyond its simplistic and misleading reliance on pure averages to assess what is “reasonably comparable” and instead adopt the well-established approach of experimental uncertainty. The most logical range for determining whether the provinces’ levels of public services (using the proxy of OSR) and taxation are reasonably comparable is ±1 standard deviation about the mean of the corresponding metric across the ten provinces.
Basing equalization on experimental uncertainly is fair and objective. It eliminates both problems discussed above. And it bypasses rather than attempting to fix the complex and abstruse current funding formula, greatly simplifying the overall reform process. These advantages offer at least the possibility of moving beyond the perennial mistrust and dispute plaguing the current funding formula.
What Does Reasonably Comparable Actually Look Like?
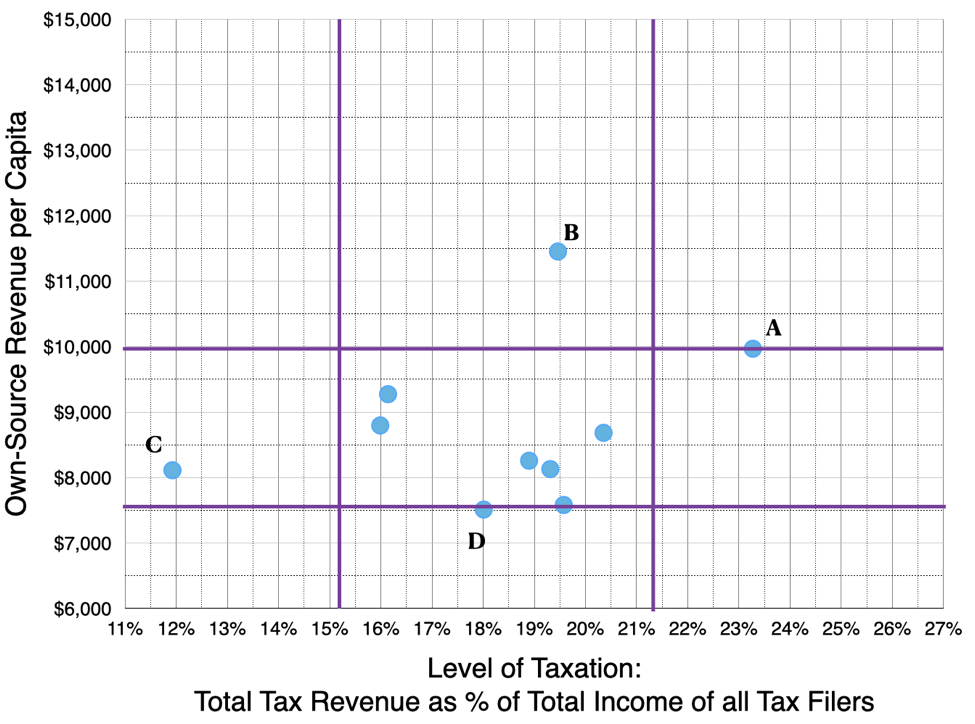
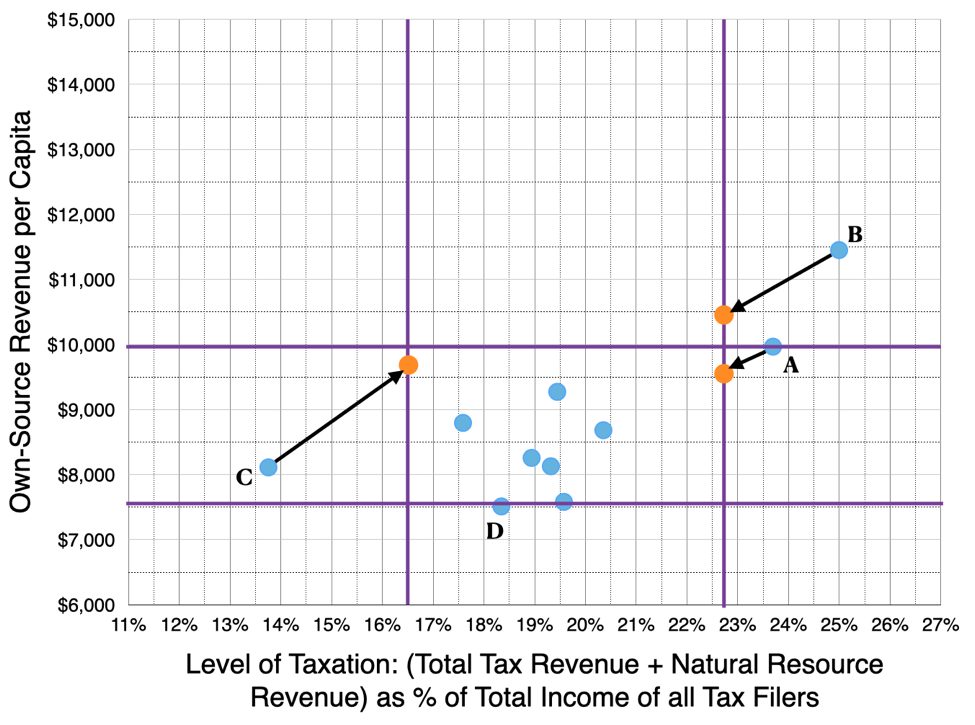
Figure 4 is a plot of OSR per capita and level of taxation, as defined above, for the ten provinces using data from 2017. To avoid needless distractions, the provinces are not named.
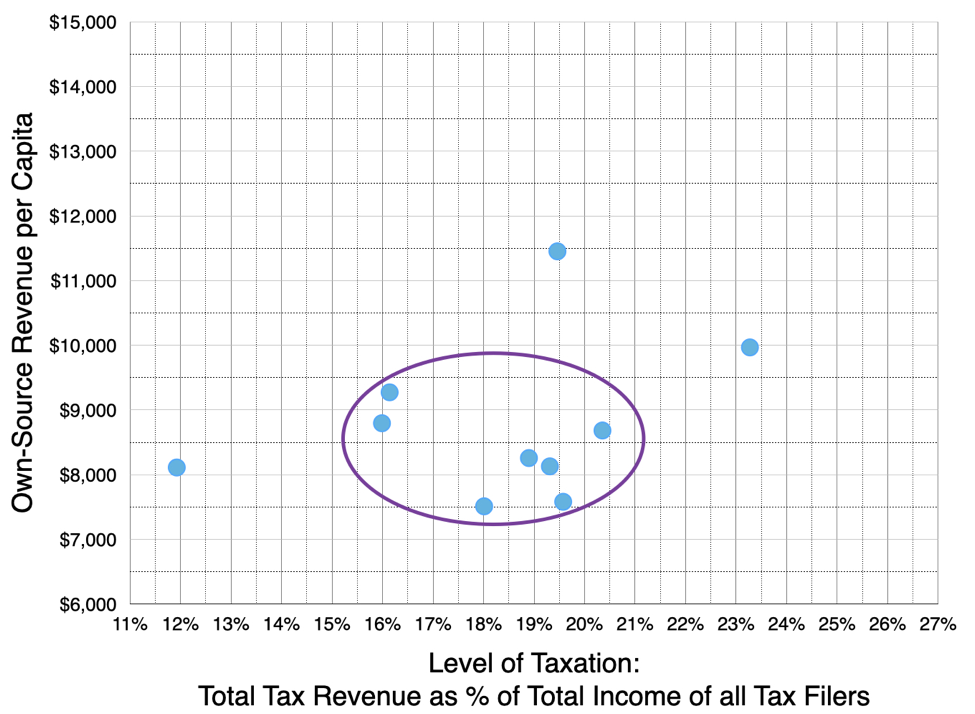
As can be seen, there are three clear outliers plus a cluster of seven provinces. While none of the seven sits exactly on the average, we should ask whether they are reasonably comparable under the principle of experimental uncertainly with ±1 standard deviation as our decision range.
Figure 5 is the same presentation overlaid with lines indicating the limits of ±1 standard deviation. The horizontal lines indicate ±1 standard deviation for OSR and the vertical lines for level of taxation. Between each pair of lines is the region of reasonably comparability for the corresponding metric. Inside the enclosed box both metrics are reasonably comparable. All provinces within this box ought, therefore, to “have sufficient revenues to provide reasonably comparable levels of public services at reasonably comparable levels of taxation,” satisfying the requirements of Canada’s Constitution. They would not be eligible for an equalization payment.
What about the four outliers? Province A has OSR at the upper limit of reasonably comparable, satisfying the public services criterion. This is achieved, however, through a higher than reasonably comparable level of taxation. Were this province to cut taxes to the reasonably comparable range, the resulting OSR per capita might fall outside reasonably comparable. In that case, the province would be eligible for equalization under our new approach. It therefore needs to be determined what A’s OSR per capita would be were its tax burden reduced to the reasonably comparable range.
This is illustrated in Figure 6. Province A’s calculated tax burden is 23.3 percent whereas the upper limit of reasonably comparable is 21.3 percent, a difference of 2.0 percentage points. Recall that a province’s level of taxation equals its total tax revenue divided by the total income of all tax filers. Accordingly, the resulting change in total tax revenue and, therefore, OSR is 0.02 multiplied by the total income of all tax filers. The corresponding decrease in OSR per capita is this number divided by the provincial population. The result is shown as the orange dot.
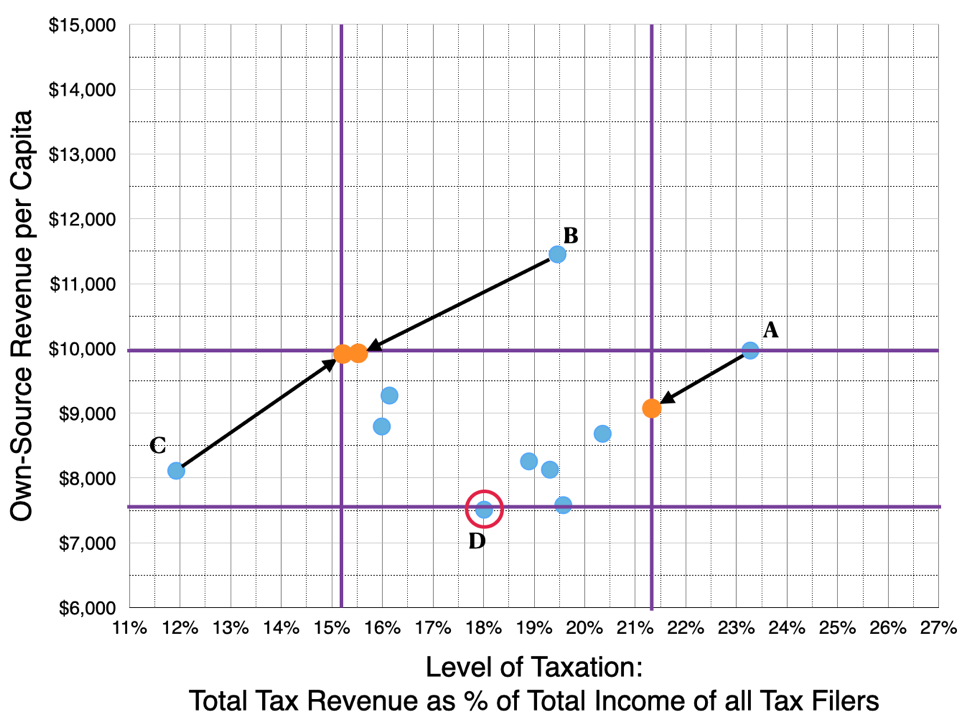
“reasonably comparable” values of each show that these three provinces would also be in the reasonably comparable box if each province made such adjustments, so they do not qualify for equalization. Province D, however, still qualifies.
With its level of taxation adjusted, province A remains reasonably comparable for both values. Thus, if this province were to decrease its tax burden to our reasonably comparable range, it would still have sufficient revenues to provide reasonably comparable public services. Province A could probably cut its tax burden nearly to the middle of the range before sliding below the reasonably comparable cut-off for OSR per capita.
The same exercise must be repeated for provinces B, C and D. Province B has a reasonably comparable tax burden and OSR per capita well above the reasonably comparable limit. Thus this province has sufficient revenues to provide reasonably comparable levels of public services at reasonably comparable levels of taxation and is not eligible for an equalization payment.
Province C, like province A, has a taxation level outside reasonably comparable but, in this case, on the low side. Even with this much lower tax burden, the province still generates reasonably comparable OSR per capita. As the arrow and orange dot show, province C has broad latitude to increase funding for public services to the upper end of reasonably comparable before it even crosses into the reasonably comparable range for taxation. Clearly, this province is also ineligible for equalization.
Province D’s level of taxation is reasonably comparable but its OSR per capita at this tax level falls just below reasonably comparable. It is therefore eligible for an equalization payment. The amount of equalization will be the difference between the lower limit of reasonably comparable OSR per capita and the province’s actual OSR per capita, multiplied by the provincial population.
The Effects of Including Other Revenue Sources in the Metrics
It might be argued that omitting certain revenue sources from our metrics for measuring OSR and taxes skews the calculated results and the positioning of certain provinces. Accordingly, the following section discusses the effects of including deficits in OSR and natural resource revenue (renewable and non-renewable) in taxation.
Deficits are undertaken to provide provinces with revenue beyond what they raise from taxes and other sources. This money is largely spent on providing public services, so perhaps deficits should be included in the calculation of OSR. The results of doing this, still using the 2017 data, are shown in Figure 7.
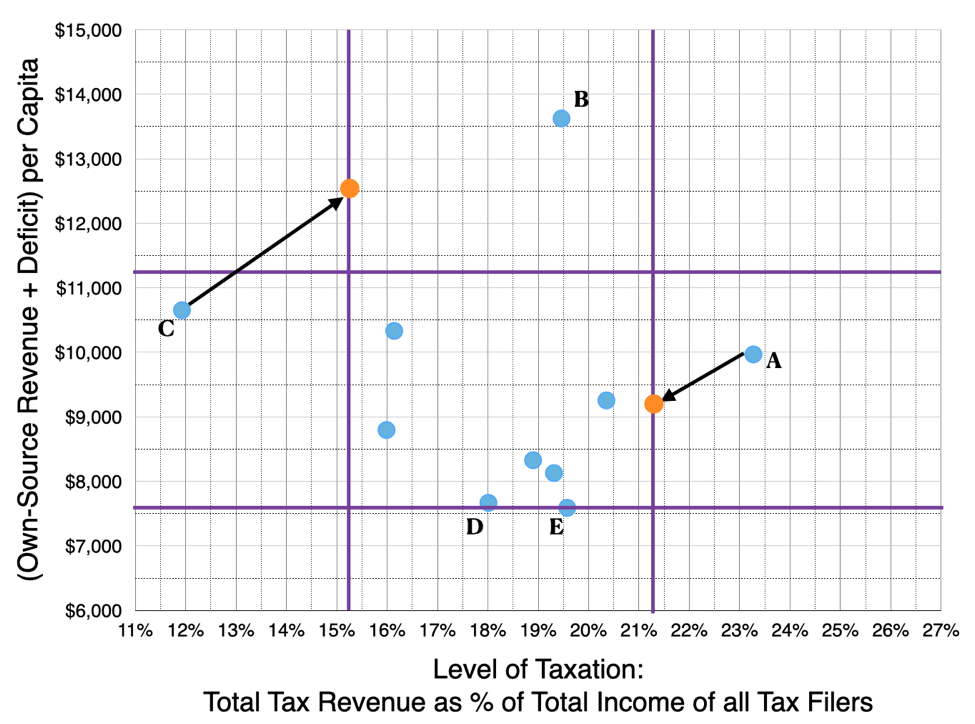
outside the box. A, B and C are in approximately the same position as before and after adjusting to the nearest limit of “reasonably comparable” remain ineligible for equalization. The fourth province outside the box is now province E rather than D, and is eligible for equalization.
As can be seen, the overall outcome is generally similar. There is still a cluster of the same seven provinces and there are the same three outliers. The normalization analysis of the three outliers with deficit spending included generates the same overall results as in the previous analysis.
There is one difference. The deficit spending of Province D, which previously was eligible for an equalization payment, brings its OSR per capita into the range of reasonably comparable, making province D ineligible for equalization. Conversely, province E, which previously was not eligible, now is. This reflects that province D incurred a higher deficit per capita than province E, which was financially more prudent. Note also that province E’s position did not change; rather, the heavy deficit spending of most provinces shifted the “reasonably comparable” levels upward, with the lower line now just above province E’s position.
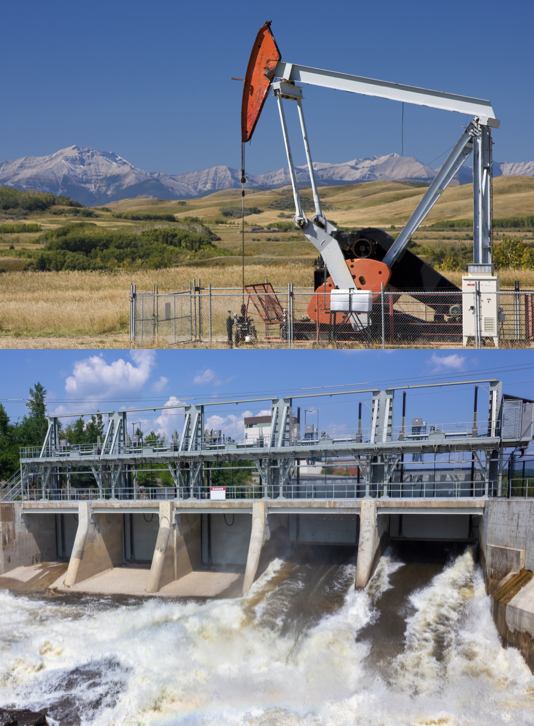
The manner of including provincial revenues from publicly-owned natural resources in the current equalization formula is contentious and has been the subject of constitutional litigation. It is a particular sore spot among equalization critics in natural resource-producing provinces, especially Alberta (as discussed in this C2C Journal article; scroll down to the second sub-headline). This issue therefore deserves discussion.
The proposed approach would include all natural resource revenue in a province’s OSR per capita in order to, in turn, assess its ability to provide reasonably comparable public services. While this will bother equalization critics, it makes sense. All of the monies derived from this revenue source are spent on public services and, therefore, contribute to determining the province’s ability to provide them. By the same token, profits generated by Crown-owned hydroelectric utilities or other government business enterprises should also be included.
In addition to naturally being part of OSR, however, natural resource revenue can also be considered a form of tax revenue. A provincial government choosing to have a very low or even zero royalty rate would need to increase one or more other tax rates to sustain its spending. Thus, in assessing the overall level of taxation – or total provincial tax burden – it is reasonable to classify natural resource revenue as tax revenue.
The effects of doing so are shown in Figure 8. As with Figure 7, the overall picture is the same, with differences only in specifics. In this case, even the sole equalization-eligible province remains the same: D.
overall result again is the same: The same four provinces are outside the reasonably comparable box and only province D is eligible for equalization.
Understanding the Results
The proposed equalization funding formula is derived from first principles: the Constitution’s clearly stated requirements for the equalization program. It uses metrics for “levels of public services” and “levels of taxation,” the two independent parameters stated in the Constitution, that are straightforward, intuitive and easily derived from objective data readily available in audited provincial public accounts and from Statistics Canada. In addition, it incorporates a well-established practice – using the standard deviation of a set of data to define a region of experimental uncertainty – to determine “reasonably comparable,” the critical constitutional criterion for determining equalization eligibility. It does away with the current, complicated and abstruse funding formula and its thicket of ad hoc provisions.
Putting the proposed approach to the test using 2017 data revealed a number of things. The most obvious, encouraging and important is that there really are no abjectly poor provinces any longer. This is consistent with a trend other commentators have noted of Canada’s provinces gradually converging in their general level of prosperity, economic and infrastructure development, and government services. Canada’s once-notorious “regional disparities” have largely melted away, at least as measured by overall provincial finances. Despite continuing talk of “have-not” provinces – a premise baked into the current approach – Canada has become essentially a nation of “have” provinces.

Figure 2 shows that eight of ten provinces are all able to generate more or less the same amount of own-source revenue per capita to spend on public services. The other two are outliers on the high side. All ten provinces, therefore, should be able to provide reasonably comparable levels of public services if using only revenue sources within their own jurisdiction.
These reasonably comparable OSR levels are generated at taxation levels that are also more or less the same for eight of ten provinces. Normalizing taxation for the outlying province on the high side would still provide sufficient OSR to fall within the reasonably comparable range, while the outlier on the low side already has sufficient OSR. In other words, all ten provinces are reasonably comparable for taxation.
Also very important and encouraging is that under the proposed formula few provinces actually require equalization and the amounts required are small. This is as it should be. Equalization should be intended and designed to provide sufficient financial help to get the recipient through a difficult period, and no more. It should not become a permanent, ever-increasing source of funds that perpetuates dependence. Unfortunately, Canada’s equalization program as operated became more the latter than the former, and the current funding formula seems designed to keep it this way. The use of the average and the creation of the Fixed Growth Rate provision both suggest this is the case.
Using the average as the key reference for equalization eligibility means there will always be provinces eligible for equalization because some will always be “below average.” As we have seen, the two outlying high-revenue provinces elevate the average, making the large majority of provinces eligible for equalization – even if the differences among them are very small and should be considered immaterial.
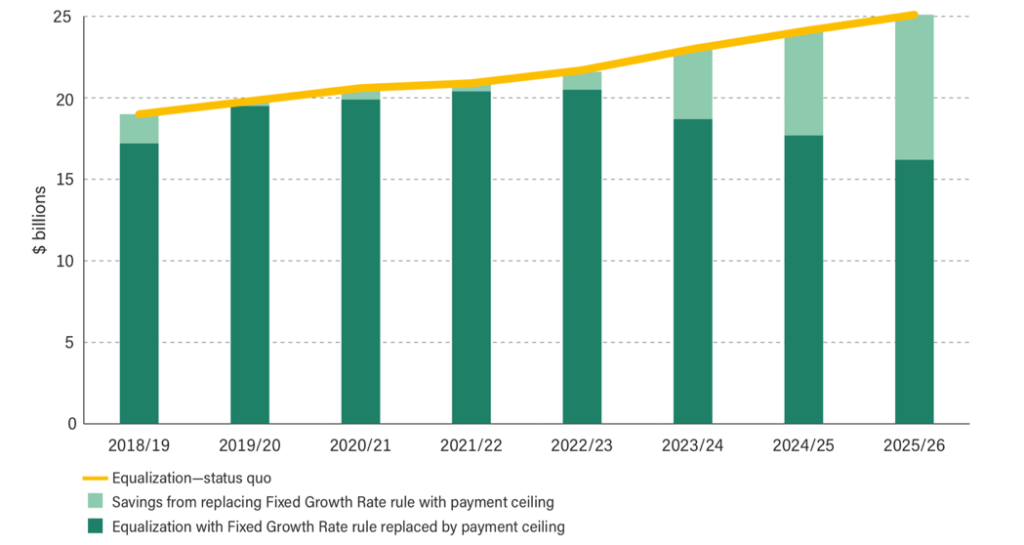
The Fixed Growth Rate provision makes things worse still, requiring that the overall amount of equalization paid out must grow in line with Canada’s GDP – irrespective of how individual provinces are actually doing in absolute terms or relative to one another. This clearly assumes that equalization payments will never cease and, moreover, that the overall payout will continually increase. By fiscal 2026, as this recent Fraser Institute article discusses, the resulting overpayment will total $8.9 billion and Ontario will be considered a “have-not” province.
A third noteworthy aspect is that the proposed approach is robust with respect to the detailed content of the metrics. This means that arguments about the content become about principle rather than effect; that is to say, is it the rational thing to do, as opposed to, will this help my own province. Still, these effects would be highly salutary in addressing the key concerns of people in the resource-producing provinces of Saskatchewan, Newfoundland & Labrador and, most of all, Alberta.
That is largely because, as noted, the overall amount of equalization paid out would decrease dramatically. The equalization program paid out $17.9 billion in 2017. Under the proposed formula the total payout would drop to $48.6 million – all going to one province. Under revised metrics that incorporate deficits and resource revenue, the total payout would be just $2.6 million. If the proposed approach were applied in the current fiscal year, only a very small fraction of the $21 billion “pot” would be required – a saving of $988 for every Canadian taxpayer.
In addition, by restoring equalization to its original concept of a fundamentally relational program – helping provinces that are genuinely struggling in relation to the other provinces to provide reasonably comparable levels of government services without crushing rates of taxation, but only if/when there are such provinces – the whole idea of an equalization “pot” could be done away with. Recall that this pot grew out of ongoing tinkering with the equalization funding formula; it is not required in the Constitution. Going forward, the federal government could easily budget for the following year’s equalization needs by evaluating recent trends for OSR and taxation in each province.